Debugging Web Apps on Android’s Mobile Browser – Part 2

In addition to the suggestions listed in Part 1, I forgot to mention one more tool. There is a lesser known browser that can be quite handy for debugging: Firefox mobile. This relatively unknown sibling of the full-blown desktop browser actually has a fairly nice, built in debugger. The one major caveat is that it doesn’t work as well as the native browser for HTML5, CSS3 and some JavaScript, but it may be just the tool you need for some quick debugging, on-the-fly. Besides it fits in your pocket along with your other mobile apps, and you don’t need Logcat.

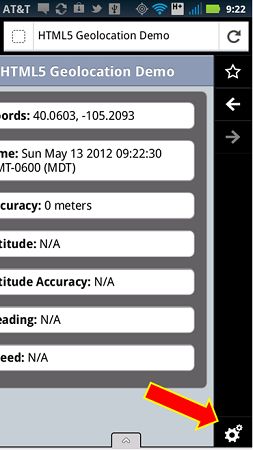
Step 1 – place your finger in the middle of the screen and drag it to the left. Click the gears icon at the bottom right of the screen.

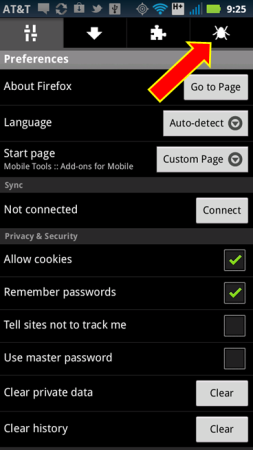
Step 2 – In the upper right hand corner of the next screen, click the bug icon

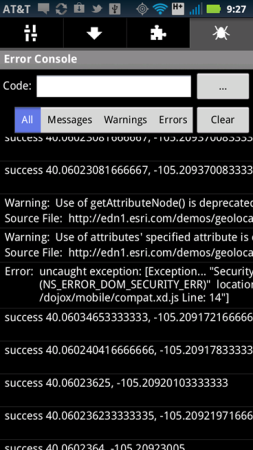
Step 3 – Scroll down the datagrid to view errors.

Debugging HTTP Requests on Native Android Apps

If your native android app uses HTTP requests, then there is currently nothing built into Logcat that let’s you see HTTP connections. Just to clarify, you can see HTTP requests in Logcat when they come from the Android browser, but not when they come from a native app.

Like many of my blog posts, I’ve done a fair amount of searching before I try to re-invent the wheel. And, on this topic, I scoured the Logcat documentation, and I looked around for several days and found nada. Zip. Zero. The bottom line is I need a full-proof, gimmick free way to test HTTP connections that will work all the time.

Here’s the Solution. Load wireshark protocol analyzer on your machine, turn it on, and then run your app in the Android emulator. There are other protocol analyzers you can use, such as Charles, but I prefer wireshark.  If you aren’t a developer and you don’t have access to the source code, then you are probably out of luck.

Why does this work? This works every time and all the time because the emulator runs on your machine, and the protocol analyzer picks up any HTTP request coming from the emulator (or anywhere else on your machine for that matter). Period.

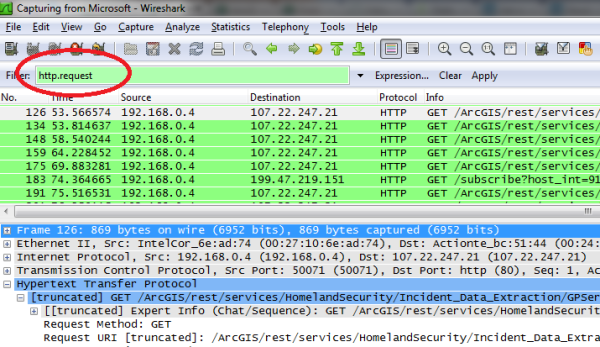
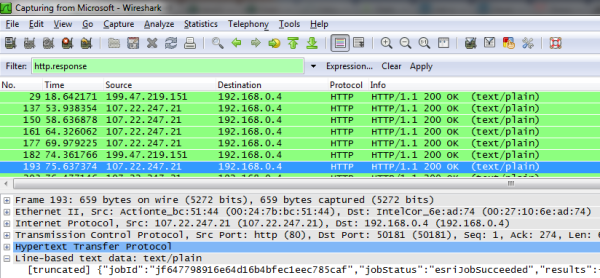
Tip #1. If you haven’t used wireshark before then when you turn it on, in the filter field apply either http.request or http.response to cut down on the noise you’ll pick up.

Tip #2. Yep, you can also use this methodology to debug apps running in the Android browser of the Emulator. Also, as a bonus, if you are using this methodology to debug browser apps, you can set the proxy settings on your phone (or browser) and point them to the IP address of the machine running Charles or Fiddler, for example. Note, this only works if your phone and proxy are on the same network, and if your wireless router also acts as a LAN router to allow HTTP connections between machines. If you don’t know how to set proxy settings for your browser just do a search on “proxy android.”

Here’s an example with http.request. The services shown in the image are publicly available:

Here’s an example with http.response:

Debugging Web Apps on Android’s Mobile Browser

For some unknown reason, Google did not include a debugger in their native browser, at least for versions up to v2.3.x. I don’t have a phone that supports a version greater than that, yet, so I can’t speak about the latest releases. Unfortunately this can be a huge productivity killer. The good news is there is a solution – you can debug the native Android browser using what’s called the DDMS, or Dalvik Debug Monitor Server, and the ADB, or Android Debug Bridge. I can also tell you this works great.

Yes, it’s true that JavaScript development forces you to have an armada’s worth of tools, tricks, libraries, phones and browsers. This is just another hammer to place into your growing toolkit. Debugging via ADB was good news for me since I do native Android development and I already have the software installed when I installed the full Android SDK. If you don’t do native development then it’s a real pain.

But, if you want to do your best to deliver bug free apps, then your best bet is to install at least ADB. I believe, but I’m not 100% certain, that you can this without having to install Eclipse along with the entire Android SDK. Yes, I agree that installing the entire SDK would seem entirely ridiculous and complete overkill for mobile web development, especially if you are not using Eclipse as your primary IDE. I’m aware that in the past I’d seen a few stand-alone versions of this floating around for both Windows and Linux. I’m not even remotely certain about Mac’s. If you do know something about this, then I encourage you to please post a comment.

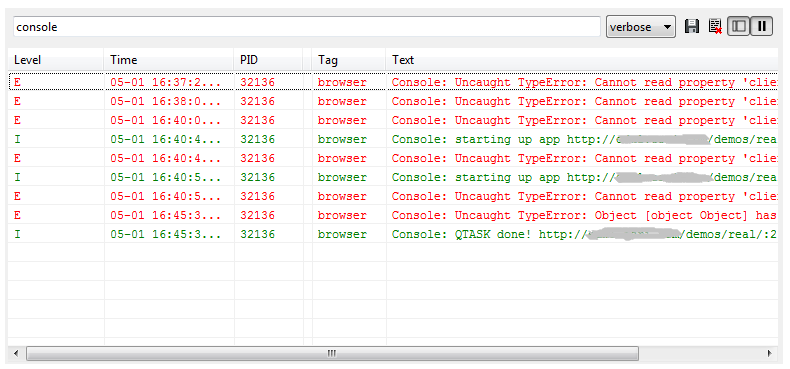
How to use ADB. My suggestion, once you’ve installed it, is to filter by the tag “console” if you are using Android v2.x and above.  Instructions on how to do filtering can be found in the ADB link below and scroll towards the very bottom of the page.

Caveat: You will have to install the Android USB device driver on your machine in order for ADB to work.  And, you will also have to have a USB cable that will connect your device to your dev machine. The drivers are different for every device. I’ve included a link to Google’s device drivers below. On a related note, for several of my Motorola Androids I had to go directly to the Motorola website to find a device driver that finally worked.

Another Possibility – Adobe Shadow! You should also be aware of a very cool development from Adobe called Shadow. As of today, I believe you can still download it for free from Adobe labs. I mention this last because, well…I haven’t tried it out. However, my good friend Kevin Hoyt, from Adobe, says it’s very, very promising. And, it’s supported on both Mac and Windows. As I write this I’m thinking that I really do need to download it and test drive it. If you have tried it, then post your thoughts…don’t by shy!

References:

Adobe Shadow + sneak peak video

Google’s ADB

Android Device Drivers

Google’s Guidelines for Web app developers